Monday, May 30, 2011

Comments Turned Off

GoldMoney. The best way to buy gold & silver

I like to read comments others leave and have learned a lot from some of them. However, I have been overwhelmed by spambots promoting Viagra, penis enlargement, term papers, and a host of other products. I have decided to turn off the comment feature for now. Such is life in the wild, wild world of cyberspace.

Feel free to email me at abrochert - my mail server is yahoo (as in yahoo dot com) if you've got a comment, etc.

I hope to turn the comment feature back on in a month or so once the electronic cockroaches have moved on to greener pastures.


Buy gold online - quickly, safely and at low prices[Most Recent Charts from www.kitco.com]

Bearish Whispers

GoldMoney. The best way to buy gold & silver


I am not interested in shorting the stock market at this time. There is no confirmation that "the" top of the cyclical general equity bull market is in. This bull market is within the context of a secular equity bear market, which is far from over. When viewed in Gold terms (i.e. priced in Gold), this secular general equity bear market is deflationary. People still argue whether or not this bear market will end up being inflationary or deflationary when priced in U.S. Dollars. I hold my long-term savings in Gold, not U.S. Dollars, and I can appreciate the logic behind both the inflationist and deflationist arguments, but Gold will win either way due to the ongoing monetary chaos. When priced in Gold, we have unequivocal secular deflation that began at the turn of the century, and thus I will continue to hold the ultimate form of cash (i.e. Gold) until the dust settles. Having said all these things, there are some important bearish undertones to the general equity markets that suggest a cyclical general equity peak is near.

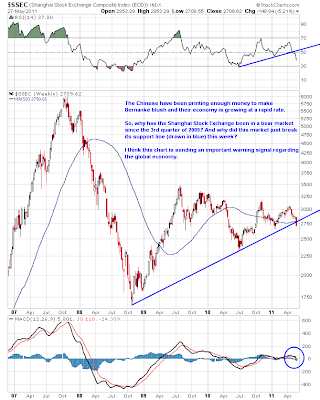
Things are always subject to change, of course, and this why punters have to pay attention more frequently than investors. On a speculative basis, I like to watch bonds, stocks, commodities, currencies and underlying technical measures of strength. All of the pieces tend to fit together, though not always intuitively. The chart that bugs me the most right now in the equity realm is China. And no, I am not talking about the FXI ETF for American traders, I am talking about the Shanghai Composite ($SSEC). Here is a 4.5 year weekly log scale chart of the $SSEC thru Friday's close:


Brazil's chart also doesn't look very good, and if any country is riding the global commodity and emerging market reflation wave, it is Brazil. Here's a 4.5 year linear scale weekly chart of Brazil's stock market ($BVSP):


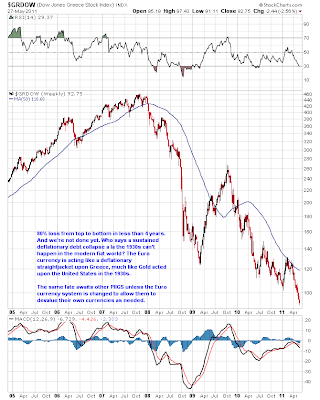
And although Greece is a small economy and a basket case, aren't they really just another canary in the coal mine for what will happen to even larger economies before this secular bear is over? Here's a 6.5 year weekly log scale chart of the Dow Jones Greece Index ($GRDOW) thru Friday's close:


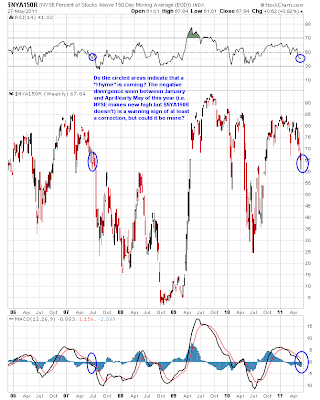
Larger, Western economies like the U.S. and Germany still have halfway decent looking charts that do not show confirmed tops yet. But the internals are starting to deteriorate in the U.S. markets. Financials and semiconductors, as sectors, failed to make new highs along with the S&P 500 last month. Also, here's a look at the percentage of NYSE stocks above their 150 day moving averages (i.e. $NYA150R), an intermediate-term look at the underlying "health" of the market (i.e. percentage of stocks participating in a bull run), using a weekly linear scale chart over the last 5.5 years thru Friday's close:


If this is a replay of 2007, a quick and scary 10% or so plunge (e.g., based on a Greek default) to scare everyone could set up one more run for a double top or slightly higher high in the S&P 500. This could also pull down Gold and silver and their stocks, a la August 2007. The government steps in, prints a lot more money, we get a bounce in stocks, and we get a major run in precious metals and their stocks while the equity bear market begins. Just a thought and not saying it will play out exactly like this, but it would fit nicely and shake out a lot of weak metal bulls before another run higher.

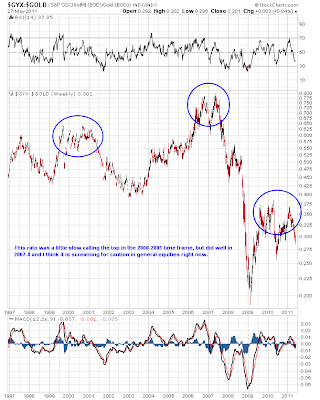
Here is another measure of deteriorating economic health, the Industrial metals ($GYX) to Gold ($GOLD) ratio. I will often use the copper to Gold ratio for this as well, but the $GYX:$GOLD chart over the past 14.5 years using a weekly log scale format chart gets the point across nicely:


When inflationary policy is "working" and trickling down to the real, productive economy, base metals should outperform Gold. Base metal use is a sign of demand related to building things and the kind of economic growth most people would like to see (though it isn't necessarily healthy growth as China's ghost cities and the burst USA real estate bubble demonstrate). When demand for Gold is rising faster than demand for base metals (assuming price is a reasonable crude estimate of demand), people are scared and looking to protect their wealth via Gold, as they don't see adequate capital projects in which to deploy hot money. This is my oversimplified view of economic reality, but it seems to work fairly well at "seeing" economic turns and I don't think this time will be any exception.

Finally, a look at short-term US interest rates. Here is a 7.5 year weekly log scale chart of yields on the 1 year US Treasury note:


Why would big money pile into 1 year government paper at a return of less than zero (i.e. when inflation is factored in)? Why wouldn't they just buy stocks instead? Or how about commodities? This is an unusual rate collapse at this point in the economic "recovery," this so-called recovery a government economic theory to which I obviously don't subscribe.

Once we have a confirmed cyclical equity top, I predict money will pour into Gold and Gold stocks. Much like in 2007-8, Gold and Gold stocks will rally despite a declining stock market. However, also like that time, speculators don't want to stay bullish in Gold stocks for too long, as the really big downdrafts in the stock market (which likely won't occur until 2012) will take the precious metals sector down as well. This should leave a good 6-9 month window for a classic (and potentially massive) fall speculative rally in shiny things in my opinion.


Buy gold online - quickly, safely and at low prices[Most Recent Charts from www.kitco.com]

Friday, May 27, 2011

Visions Of A Mad Gold Stock Speculator

GoldMoney. The best way to buy gold & silver


A series of long-term charts suggests to me that we are getting ready for a Gold stock explosion higher that should begin before the summer is over. I am biased due to being rabidly bullish on Gold stocks right now, both intellectually and financially. Please take the following technical analysis smorgasbord with a grain of salt given my greedy dreams of speculative riches, which clearly bias my perspective.

Technical analysis should be objective, but the reality is that one person's bullish chart is another's bearish warning chart. This is what makes markets and why it ain't always easy to make money as a trader. In any case, I believe we are on the cusp of a major move higher in Gold stocks as a sector.

I think the bottom in Gold stocks will roughly correspond with a cyclical top in general stock market indices, a la 2001-2003, 2007-early 2008 and 1973-1974. Many Gold stock investors equate general equity bear markets with Gold stocks getting slammed due to the 2008 fall crash fiasco that dragged down everything except the U.S. Dollar. Funny how memories are not only selective but also favor recent history over older history.

One thing is clear: when the stock market drops precipitously over a short period of time, babies get thrown out with the bathwater. But even the October, 2007 thru March, 2009 bear market saw Gold stocks advance significantly during more than half of this bear market period (i.e. October, 2007 thru March 2008 and October, 2008 thru March, 2009). Because bear markets make people nervous and because no one can say if the "wicked" part of the bear market will come up front or not, it takes nerves of steel to be a Gold stock bull when you are anticipating a general stock market cyclical bear.

However, I am suggesting that it is time to do precisely this. I would favor a deflationary-type bear market over an inflationary-type bear market, but I don't claim to know for certain. There is no reason the U.S. Dollar can't rally here against other worthless currencies, as all currencies are sinking relative to Gold (and silver). The paperbug game is to focus on the individual currencies and deliberate about whether a total overall government debt to GDP ratio of 200% versus an annual fiscal deficit of 10% of GDP is more important. I call a deadbeat a deadbeat and keep my savings in physical Gold, the only hard currency that can't be effectively issued by decree. It is for this reason that the GLD ETF is not a "safe" savings vehicle, but rather a short-term speculative vehicle, as it is designed to divert money from the physical Gold market and allow the paper game to continue for longer than it should.

I have been a hard-core bear on general equities over the past 2 years. I have been very, very wrong. But, there is a limit to what a bear market rally within the context of a secular equity bear market can achieve. We are fast approaching that limit. Now, I no longer think I know exactly when that top will occur, but I don't think we make it to the end of the year before the bear market begins. The topping process may take another few weeks or another few months. In the end, I don't really care.

The reason I don't care is because I think Gold stocks are going to rocket higher and more money can be made going long Gold stocks than going short the market, at least for the first 6 months or more of the looming cyclical stock bear market. And, as any seasoned Gold stock investor should know, Gold stocks can move awful fast - a gain of 100% or more in the Gold stock sector in 6 months is not a pie-in-the-sky proposition.

Anyhoo, onto my tea leaf tools. Here are some charts that I think are screaming for bulls to buy on the next dip. The last dip was a great buying opportunity and the next low may or may not be a lower low, but I think we'll get another significant pull-back in general Gold stock indices.

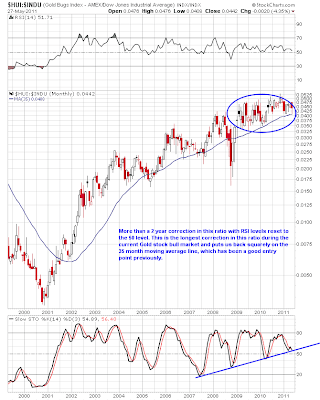
Here's a chart that compares the HUI Gold Bugs' Index ($HUI) to the Dow Jones Industrial Average ($INDU) Index (i.e. an $HUI:$INDU ratio chart) over the past 12 years thru Friday's close:


And I can't seem to do an analysis of the Gold sector without some form of Dow to Gold ratio chart. Here's a 12 year chart of the Gold to Dow Jones ratio chart thru Friday's close (i.e. a $GOLD:$INDU ratio chart):
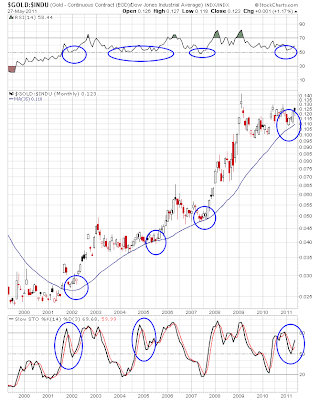


And why does the Gold to Dow Jones ratio matter when it comes to Gold stocks? Well, let's look at the entire history of the current secular Gold bull market that began at the turn of the century. Here's the same Gold to Dow ratio chart (i.e. $GOLD:$INDU ratio chart, the candlestick plot) plotted along with the $HUI Gold Bugs Index (black straight line) on the same chart over the past 12 years:


And finally, the concept of the "real" price of Gold. I learned this concept from Bob Hoye and I think it is key to understanding Gold miner profitability. Profits eventually should be reflected in stock prices, though many Gold mining companies seem to do whatever is in their power to make sure this isn't the case... (e.g., share dilution, political struggles, Gold price hedging, etc.). When viewing Gold stocks as an overall sector, however, the real price of Gold is important and I use the Gold price divided by the $CCI or $CRB commodity indices. Because energy is an important cost to mining firms, the heavy oil weighting in the $CRB index may actually be a good thing. In any case, here is the $GOLD:$CRB ratio chart over the past 12 years:


I think Gold and Gold stocks could top on a short-term basis in the next week or so, then decline to a potential final low in June. Summer is rarely an exciting time for the Gold sector, but buying when things are quiet is often a way to reap rewards once the fall hits. We could have a summer spike lower like we did in August of 2007 or things could simply drift quietly lower in the Gold sector. In any case, we are getting to the point where the Gold bull market is going to outshine every other market. If it's a deflationary bear market with the US Dollar rallying, which I would favor, the Gold patch will be the only place to be. If it's an inflationary bear market with the US Dollar crashing, then silver will likely outperform Gold again. I don't claim to know for sure, as trying to pick the prettiest paper currency troll is not an interest of mine. Gold will win the Clash of the Titans battle in the currency arena, of this I am certain.

Stay long in physical Gold until the Dow to Gold ratio gets to 2, and we may get below 1 before this secular economic mess is over. Gold stocks are for the speculatively inclined, not the faint of heart. However, I believe this summer is a speculative buying opportunity in the Gold patch that will looked back upon as a "duh, of course I should have bought"-type opportunity. This mad Gold stock speculator couldn't have a more rosy view of the future, but only when the future is priced in Gold.


Buy gold online - quickly, safely and at low prices[Most Recent Charts from www.kitco.com]

Saturday, May 14, 2011

Bullish Thoughts on Precious Metals

GoldMoney. The best way to buy gold & silver


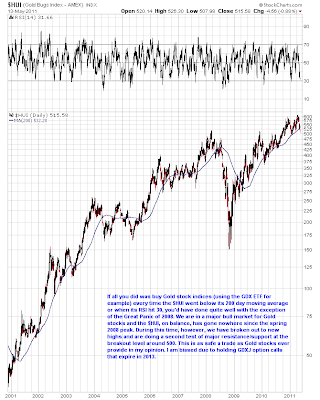
An intermediate-term play in the precious metals may be at hand. I like the chart of the $HUI here quite a bit. Here is a log scale chart of the $HUI mining index since 2001 in a log scale format:


I also like what is going on in terms of the ratio chart between the GDX mining ETF and the Gold price (i.e. GDX:$GOLD ratio chart):


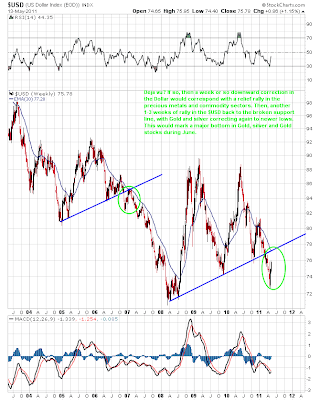
The U.S. Dollar Index chart ($USD) also suggests to me the possibility of a significant bottom in the precious metals sector in June. Here's a chart of the $USD over the past 8 years with my thoughts:


The key in my opinion will be to watch how Gold stocks react. I think they will rally next week because they are so oversold. This would tie-in well with a drop in the US Dollar. Then, if the Dollar rallies again for 1-3 weeks in a second up leg to complete a simple short term A-B-C correction in its bear market, which would help to reset sentiment in the Dollar's favor, Gold and silver should drop again to lower lows. If the major Gold stock indices fail to make a lower low along with the Gold price, this would be a powerful signal in my opinion that we won't have to wait until the fall for further bullish fireworks in the precious metals sector. If Gold stocks instead do make a significantly lower low along with Gold in this proposed scenario, then a longer-term correction is likely in store and the summer may be rather boring/choppy.

Just my 2 cents and it's all a guess of course. In the longer term, this is all just noise on the way to a Dow to Gold ratio of 2 or less.


Buy gold online - quickly, safely and at low prices[Most Recent Charts from www.kitco.com]

Sunday, May 8, 2011

Industrial Metals to Gold Ratio - A Warning?

GoldMoney. The best way to buy gold & silver

I like ratio charts to give a sense of relative value. This is important to me because we live in an anchorless fiat world where price is not meaningful in a vacuum. Gold is the global monetary anchor, whether paperbugs care to understand/believe it or not. I have always liked the copper to Gold ratio but other industrial metals in their ratio to Gold can give similar information. I find the current chart of the $GYX (an industrial metals index) when priced in Gold (i.e. a $GYX:$GOLD ratio chart) rather interesting.

Here is a log scale ratio price chart of $GYX:$GOLD since 2003:


The last major trend line break was a warning signal for the end of the last cyclical general equity bull market. Will history repeat? I believe it will but I have no interest in shorting the stock market at this time. I may after a confirmed major trend line break in general equity indices and a subsequent relief rally higher, but not now.

Pricing things in Gold is an important concept for those who hold physical metal. It is shocking to see how much the Dow Jones and housing prices have declined in Gold terms since their peak. The nominal declines are much less severe. This is why printing is the best way out for governments around the world. It worked in the 1970s and it might just work again. The problem for the U.S. is that its problems are much bigger this time around than in the 1970s, so that the amount of monetary inflation needed to combat the ongoing economic problems is much greater.

If the Dow Jones Industrial Average is at the 10,000 level in 10 years but a loaf of bread costs $15 at that time, many people will be fooled into thinking things aren't that bad. The boiling frog analogy is apropos here. Private debt is being extinguished by putting it on the public books! This is high treason right in front of our eyes, but it will continue. Consider Fannie Mae and Freddie Mac needing $259 billion from taxpayers to bail them out. Now this $259 billion is a current number and it will go higher before the real estate bust is over - count on it since the government now backs 85% or so of all mortgages in the United States.

When you transfer all that bad debt to the government balance sheet, you weaken the currency. U.S. Dollar-centric deflationists assume that the laws will be followed and that what is reasonable and appropriate will be at least a minor consideration. These assumptions are erroneous, as recent policy decisions and policymaker law breaking have shown. What if almost all the bad debt created and/or held by "the friends of Angelo" [i.e. Angelo Mozillo of Countrywide], by which I mean to sarcastically refer to the major financial corporations of America, is placed on the government balance sheet?

Gold is a buy at current levels. The current monetary system will be replaced before this secular equities bear market is over, whether in 5 years or 15. The best way for the average person to protect their financial wealth is to buy and hold physical Gold outside the banking system. Other precious metals should also do well and may do even better, but they carry a higher risk. The longer the chaotic policy response to unavoidable economic outcomes continues, the higher the chance that the Dow to Gold ratio will fall below 1 this cycle and the higher the likelihood that this ratio will bottom with Gold in 5 digit territory.


Buy gold online - quickly, safely and at low prices[Most Recent Charts from www.kitco.com]

Monday, May 2, 2011

Why Do You Need a Non-Leveraged Core Position in Precious Metals?

GoldMoney. The best way to buy gold & silver

The answer to this rhetorical question is found in the market manipulation seen last night in silver. Those in the paper pits using leverage and short-term instruments to play the metals game can get wiped out in a flash. Trust me, I've got first hand experience. Read this post by Dave In Denver at the Golden Truth to get the gist of the most recent blatant "take down" in silver during thin overnight electronic market trading while many overseas markets were closed.

This is not tin foil hat conspiracy, this is how the casino works. The house has to always win, on balance. And when they don't, the government steps in and bails the house out with your purchasing power. It's sick and it's wrong and yet it's how the world works (and has for centuries). And no, it's not limited to the precious metals markets, but these are politically important to the status quo. "Gold is the enemy," at least according to Paul Volker and Alan Greenspan back before he became an integral part of the machine.

The point is that no one can shake that physical metal out of your hands by playing tricks with the paper price. I am not saying don't engage in trading (now THAT would be a case of the pot calling the kettle black!). Many of us are speculators because we live in a fiat world gone mad and there are few options left to protect purchasing power in this environment. Speculation always runs rampant in societies caught in the throes of a dying fiat currency. The decline of the American Empire is not unique or even special in this regard. Excessive debt associated with military imperialism - nothing new in that recipe! Does anyone actually believe that we will now reduce the number of troops in Afghanistan now that we have supposedly killed the Mythical Boogeyman? At least I think Osama bin Laden was the reason we started an undeclared war in Afghanistan (in true Orwellian fashion, it's getting harder and harder to remember exactly why Eurasia went to war with Oceania).

Anyhoo, make sure you have a solid core position in physical metal before you start throwing chips onto the electronic trading casino table. My metal of choice is Gold, but I own a little silver and I respect those who prefer silver, platinum and/or palladium. To me, Gold is the no-brainer, safe investment for the next several years. It has lower risk than other precious metals, but this means it has a lower potential reward. For most mortals, holding physical metal will yield greater gains than speculating on short-term price fluctuations in metals or metal stocks. Much like Las Vegas, the stories of those few who won big keep the moths coming back to the flame (including this not-humble-enough moth).

A series of significant margin hikes in silver coupled with an intentional smack down in its price during thin trading turned lucrative profits into margin calls for several retail traders last night. Wash. Rinse. Repeat. Don't play with dynamite unless you're ready to get blown up.

In the long run, last night's shenanigans will be nothing but a nearly imperceptible blip on a long-term chart of the bull market in silver. Those who got burned will look back and curse themselves for being so aggressive at such an overextended price point. Like the tortoise and the hare, 95% of the speculators (the hares) will be surpassed by physical metal owners (the tortoises) who are happy to just ride the bull at its own pace. And those who own paper metal as their core holding are also playing with a form of fire, as the rules of ETFs and ETNs are subject to change without notice and their counter party risk is increasing exponentially as this secular general equity and real estate bear market for the ages continues to grind onwards.

I still play poker with the sharks using a portion of my savings, but with a jaundiced eye and an itchy trigger finger that has learned to take losses quickly. I now watch the paper shenanigans with a mix of amusement and sadness. As a [temporary?] Goldbug, I know I have to be careful what I wish for in this environment. There are no easy ways out of the mess America and other "advanced" economies have created for themselves. Life will go on and people will survive, thrive and have fun in the mean time. Doomsday scenarios have no place in a serious investor's vision of the future, as investing is a waste of time if the "end" is near. I'm all for survival skills and being prepared for temporary chaos, but this to me is not investing (i.e. not really a financial topic).

Own physical metal if you are interested in the precious metals space. Once you have accumulated a comfortable "nest egg" in physical metal, whatever that means to you, then go ahead and speculate if that's your thing - whether it be via leverage, short-term paper trading and/or dabbling in junior metals stocks. There is plenty of money left to be made in the current secular Gold bull market, which promises to be one for the ages. Don't be the hog that gets slaughtered when it's so risk-free to be the bull that makes money.

Having said all this, I'm buying the freakin' dip tomorrow if silver goes down any further using the AGQ double bull paper silver ETF in my speculative account for a short-term trade...

;]

Buy gold online - quickly, safely and at low prices[Most Recent Charts from www.kitco.com]

Sunday, May 1, 2011

Gold - Jumping the Track Or Reaching a Routine Target?


GoldMoney. The best way to buy gold & silver
When looking at longer time frames using technical analysis/charting, it is often appropriate to use a log scale price chart versus using a linear scale price chart for shorter-term time frames. But at what exact time frame should you switch from a log scale chart to a linear scale chart and what are the exceptions? Well, the answer is that we are dealing with art as much as science when using technical analysis.

But while doing my weekly exercise in charting the Gold universe, I found an interesting discrepancy in the Gold chart between its current price level and its prior speculative price peaks earlier in the secular Gold bull market. As an aside, the secular Gold bull market is far from over, so these are only short-term considerations. However, these charting issues could have quite profitable short-term implications for those riding the Golden bull.

Without further ado, here are the charts that have me intrigued. First, a log scale chart over the last 7 years of this Gold secular bull market ($GOLD) thru Friday's close:


Great news and it means we have plenty of upside potential left for the current Gold run. However, the linear scale chart over the same 7 year period demonstrates an interesting and slightly different trend line situation:


So, which chart is correct? Are we heading to a routine price target or jumping the shark and entering a more aggressive phase of the Gold bull market? The answer, I believe, is the latter. I base this partly on the recent action in silver, which has far outperformed Gold over the past year. Here is the linear scale chart of silver ($SILVER) over the same past seven years:


Obviously, silver is in a new linear trend, but it presumably would stop at it's log scale trend line - or would it? Here's the log scale chart of silver over the past 7 years:


The "hot" money has made a boatload of cash in silver and there's likely still more to be made in this intermediate term run for the white metal. However, rotation of speculative money into Gold has likely begun and things could be just starting to heat up. As Sinclair has been saying, $1650 is in the bag for this run. However, could we also be looking at jumping the log scale trend line on this move like silver has done?

It certainly feels like the right time during this bull market in Gold for the transition to begin. The log scale trend line in Gold is likely to result in short-term profit taking as the linear scale trend line did in silver. However, I think it would be just another buying opportunity if it happened.

When the Dow to Gold ratio gets below 2, then I might consider starting to look around for other investment opportunities and selling some physical Gold. When I do sell some Gold, it will likely be in order to buy Gold stocks with the proceeds, which will likely peak after the Dow to Gold ratio bottoms (as they did in the previous two cycle nadirs in the Dow to Gold ratio). Until then, I'm just going to keep enjoying the ride in Gold.


Buy gold online - quickly, safely and at low prices

[Most Recent Charts from www.kitco.com]

Wikinvest Wire