
src="http://pagead2.googlesyndication.com/pagead/show_ads.js">
src="http://pagead2.googlesyndication.com/pagead/show_ads.js">
Many people like to look at Japan as instructive relative to the current situation facing the United States (and most of Europe). The current strong up move in stocks has been relentless. It has been no fun and of no use lately to eruditely point out how bad the underlying economy is and how bad the housing market and banking system is. There is little point of understanding the economy as an investor if you cannot make money using the information. Being a general stock market bear has been an incorrect and painful position since the March 2009 lows in many global stock markets.
But this is simply a statement of the trees that are in front of our eyes. A secular bear market is the forest in which the trees live. For those who say that inflation and money printing will keep stocks afloat from here on out, I would direct you to re-study your stock charts in the 1966 - 1982 period. There was plenty of currency debasement and stocks went nowhere in nominal terms for over 15 years. In real terms, buy and hold stock bulls got slaughtered as bad as those who held thru the 1929-1932 bear market!
The current long-term chart of the NASDAQ composite index looks eerily familiar. Here is a log scale weekly candlestick chart of the NASDAQ ($COMPQ) from 1995 thru today's close:
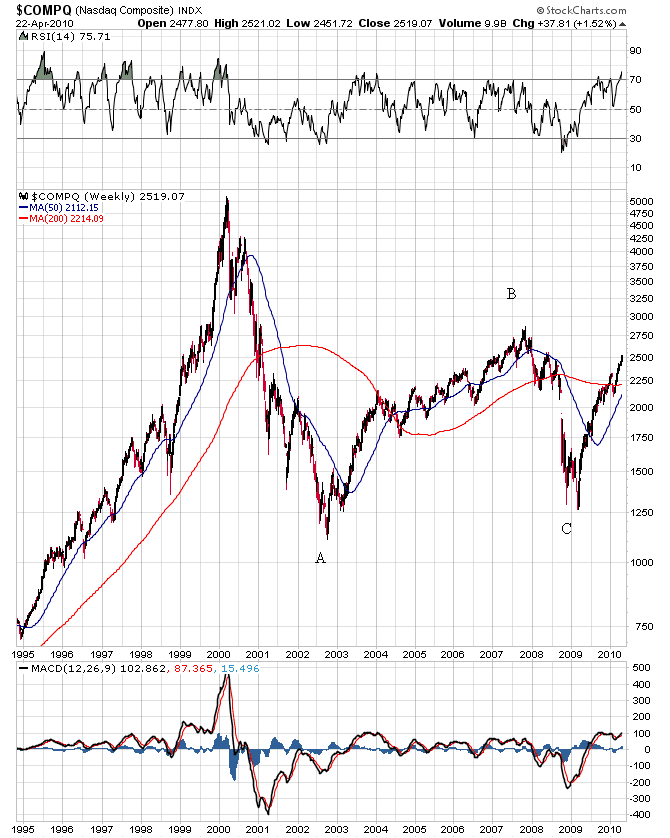
Why does this chart look and "feel" familiar to me? Because it reminds me of the Japanese stock market chart when looking at its recovery after the 1997-1998 Asian financial crisis. Much like the U.S.-centric financial panic into early 2009 with the NASDAQ, the Asian crisis of the late 90s occurred deep into a Nikkei secular bear market. The NASDAQ bubble popped in 2000, so getting caught up in the cyclical bear market of 2007-2009 didn't really make things any worse for the NASDAQ, it just caused the NASDAQ to revisit its previous bottom made in 2002. Japan's stock market bubble burst in 1990 and the Asian financial crisis of 1997-1998 did the same thing to the Nikkei index.
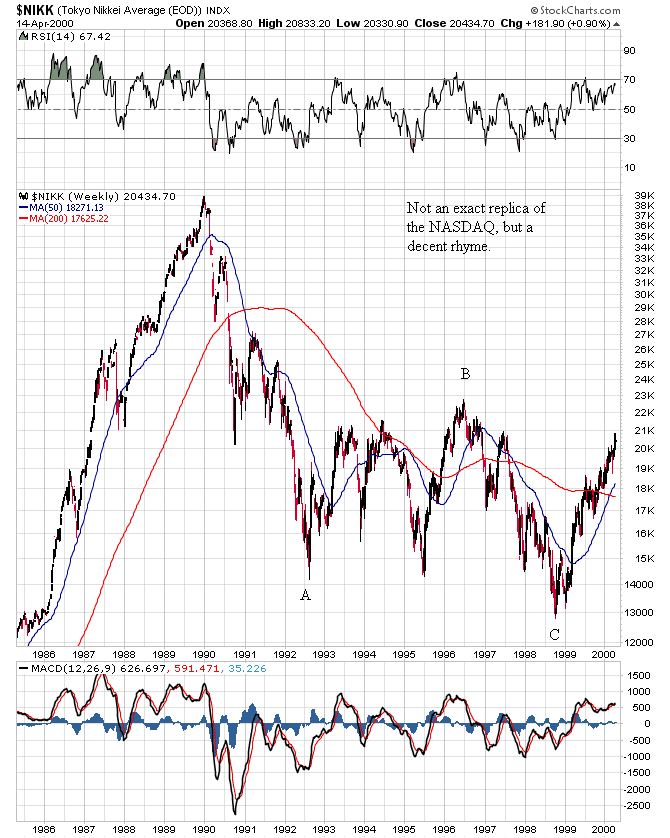
The rebound for the Nikkei out of that 1997-1998 cyclical bear market was fast and furious and crushed the bears. Here's a weekly log scale candlestick chart of the Nikkei stock index from 1985 thru 2000 to show the similarity to the current NASDAQ chart:
And, as one of my favorite themes, here's what came next:

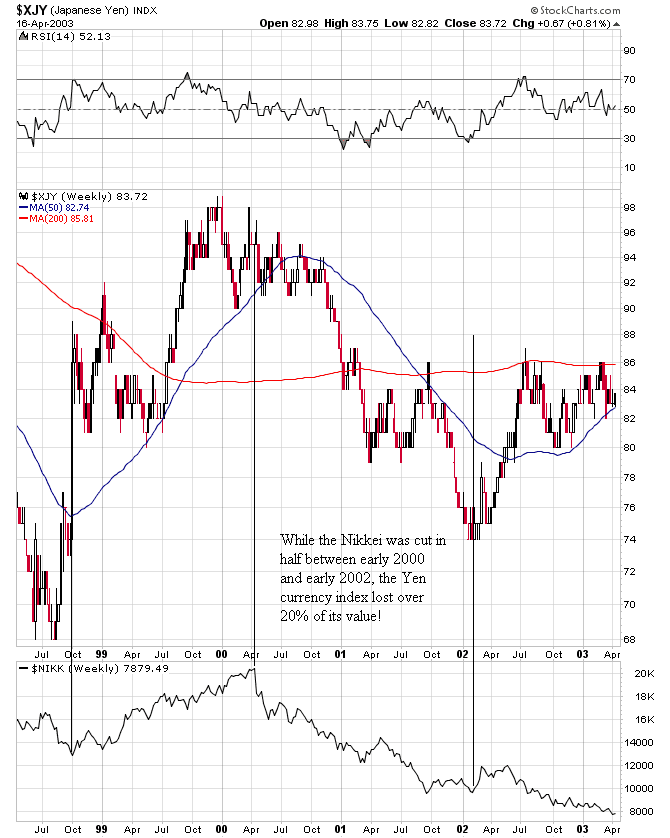
Not a prediction per se, but a warning not to lose sight of where we are and where we need to go before this secular bear market can end. There is too much debt and too much fraud that need to be cleaned up before a new secular bull market in general stocks has a snowball's chance in hell of beginning in my opinion. Now for those who look to helicopter Ben to trash the U.S. Dollar and save the stock market, here is a lesson from history on currency debasement during a similar period in the Japanese secular bear market. The following chart covers the 1999 bull market and subsequent 2000-2003 bear market in the Nikkei stock market ($NIKK, the black linear plot in the bottom of the chart below) in order to show how the Japanese Yen index ($XJY, the main candlestick plot) fared during this time:
Now, returning my thoughts to Gold, the Gold chart priced in U.S. Dollars looks a lot like a chart of the NASDAQ ($COMPQ) as well, but during a different time frame:

I'm sure you know what came next in this case, but just so that you don't underestimate the power remaining in this secular Gold bull market, which is far from over, here's what came next back then in the NASDAQ:


![[Most Recent Charts from www.kitco.com]](http://www.kitconet.com/charts/metals/gold/t24_au_en_usoz_4.gif)

