src="http://pagead2.googlesyndication.com/pagead/show_ads.js">
src="http://pagead2.googlesyndication.com/pagead/show_ads.js">
David Nichols does some interesting work on fractals as they relate to Gold. Here's a link to his website if you're interested in learning more. I am not a subscriber and have no relationship with him but have read some of his free articles on the web and at his website over the past few years.
Mr. Nichols sees Gold as having entered a parabolic run that may end as soon as early 2010. I have no idea if he's right or not, but the work is interesting and in my opinion is along the same lines as Elliott Wave theory. The rational market hypothesis is obviously worthless, so it is helpful in my opinion to seek out other explanations for market movements.
I was noticing an interesting parallel on the current monthly Gold chart and the NASDAQ chart leading up to its 2000 climax and that the similarities were a little uncanny (the NASDAQ is one of Mr. Nichols' classic examples of a parabolic run). Here's the two charts I created to show the similarities if these two runs end up being similar. First a 10 year monthly non-log scale candlestick chart of the Gold price ($GOLD):
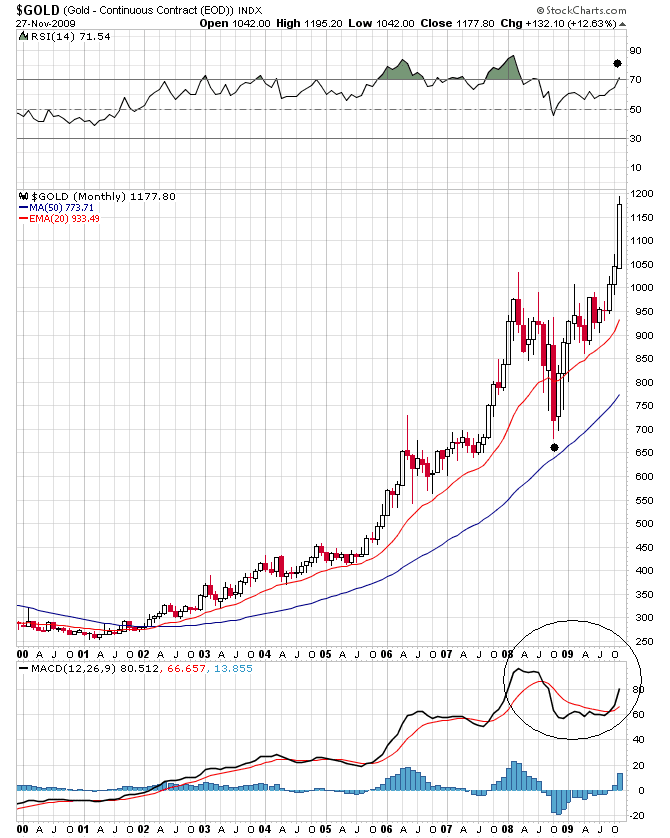
Next, a similar chart of the NASDAQ ($COMPQ) thru the end of 1998:

Kind of similar, no? Here's what happened next in the NASDAQ:

The main problem with this pattern, if this is what's going to happen to the Gold price (I don't claim to know), is that it is awful hard to pick the top in real-time in such a pattern. And if you hold on too long, you're not going to like what happens on the back side (think NASDAQ 2000-2003 or oil last year after the top was in). Those who are married to Gold and who are die hard into the politics (I like the politics, too, but I'm in this to make money) don't like to hear of such talk, but Gold did a similar thing in 1979 and then collapsed after the early 1980 peak.
If this pattern is what's going to happen, that would put the top for Gold in the $2400-2500/oz. range in the first half of 2010. I certainly wouldn't be disappointed in such an outcome. Let's just say that if the Gold price chart keeps tracking the NASDAQ in the same uncanny manner, Gold investors will have to be prepared for a similar resolution. Such a pattern would also create a significant opportunity for shorting Gold on the backside of its price collapse (I know, I know, it's heresy to say such a thing at a Gold site).
Also, keep in mind that Gold stocks will likely peak after the Gold price (and after the Dow to Gold ratio bottoms) and may actually have one of their strongest bull moves after the Gold price peaks if 1980 is a decent guide. As an example of what was typical in the senior Gold patch back then, here's a chart of Homestake Mining versus Gold back then (I believe I stole this chart from a piece by Frank Barbera a while back but I can't remember for sure):

And here are some examples that include junior mining shares (the following table was posted by a CIGA over at jsmineset.com not too long ago) - get ready to smile if you haven't seen this before:

Anyways, the "dueling parabolas" concept is certainly food for thought in my opinion. It's going to be hard to know when to sell Gold for sure. I know we're not close yet at $1200/oz, but once we get over $2000/oz, an exit strategy will be an important part of my investment plan as a long term physical Gold holder. The Dow to Gold ratio is my most trusted guide for this cycle, but once we get to 2, I don't know exactly how much lower this ratio is going to go (Ian Gordon at Long Wave Group has said before that he thinks we're going to reach 0.25 in this ratio!). I figure if I sell my physical Gold too early, I'll just be using the proceeds to buy Gold miners anyways, so I don't think I'll miss too much of the party if history is a reliable guide.


