src="http://pagead2.googlesyndication.com/pagead/show_ads.js">
There's time and there's price. If you believe, like I do, that a deflationary wipe-out must occur before further cancerous U.S. Dollar debasement (oops, I mean green shoots) can, then you should also believe that this cyclical bear market in general equities ain't gonna take much longer if history is a guide. Most such wipe-outs take 2.5-3.5 years. We're already 1 year and 8 months into this bear market and I personally count the last 7 months (since November panic lows) as one big expanded zig zag correction.
The time issue is important when trading intermediate-term swings and figuring out when it will be time to get back in for "the big rally" or the real re-flation trade (i.e. a new cyclical bull market rather than a 3 month manic melt up correction). The deflationary collapse issue is important because you are not going to see a market in a deflationary collapse mount a big rally that goes far above the 200 day moving average for a prolonged period of time in such a bear market. That just isn't the way they work. Think 1929-1932 bear market and it's the spring of 1931 right now.
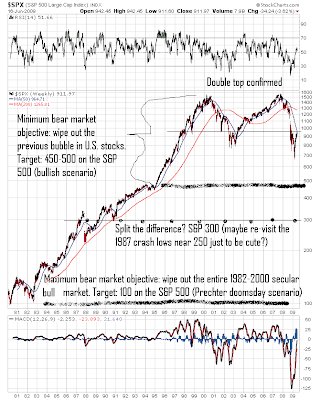
So, how far down are we really going to go if you subscribe to the deflationary market wipe-out model? While I realize there are opposing inflationary arguments, I'm not going to revisit the deflation versus inflation argument at this time. In the 1929-1932 bear market, if you buy the "spring of 1931" argument as an equivalent point in time (which I think is quite reasonable), we'd be facing about a 75% loss from here until the final lows that would occur a little over a year from now. Please don't think it can't happen.
But let's take a look at the charts to see what's reasonable and what's likely. Following is a roughly 30 year weekly log scale candlestick chart of the S&P 500 with my thoughts:

Why so bearish? First, history teaches that a debt bubble popping spares very few and the market crash is generally quite severe as a prelude to the subsequent economic depression that occurs. Second, remember the FIRE economy? You know the acronym describing what our economy is based on that stands for "Finance, Insurance and Real Estate")? Well, let's take a look at two of the components of of the FIRE economy. Let's start with real estate. Following is the U.S. Homebuilders Index (10 year weekly log scale chart of $DJUSHB):

Next, let's look at the financial sector using the banks (10 year weekly log scale chart of the $BKX):

Insurance indices have generally only lost about 70-75% peak to trough, so their stocks are the bulls of our economy. Now, the FIRE companies have already laid off an insane number of workers and they are the primary basis of our whole economy. Many of these companies are fighting to survive and many of those currently left standing and not already nationalized won't make it.
So, what is left to drive our broken FIRE economy besides the U.S. government? The auto industry?! Retail?! Hollywood, Apple and Google can only be expected to do so much. The FIRE stocks have already sunk and are set to make new lows and the rest of the market will go down rapidly with them now as the final leg of the bear market gets set to destroy all hope with only a few quick fibrillation-inducing corrections along the way.
Those invested in physical Gold can sleep well at night and simply wait for the Dow to Gold ratio to come down to 2 or below and then prepare to trade their Gold for stocks or other paper investments as the next cycle begins. Gold stocks will not be immune from the downdraft but have already made a major cyclical bottom and will not be making new lows along with the rest of the stock market. I would recommend waiting before putting new money into the Gold mining sector, despite the fact that I think Gold is about to bottom and re-test its all time nominal highs right along side a rising U.S. Dollar Index.


